

Student Network Optimization focuses on connecting students to each other with different profiles. An art student could learn a different perspective on their work from a business lead and vice-versa. This project focused on providing a tool to give an indication for student collaboration. To expand their network and knowledge.
1. Background
- Obtain data,
- Standardize the data,
- Create metrics to quantify student network diversity,
- Develop a dashboard to assist students.

2. Data obtainment
At the beginning of a semester, all Delta students get together to select the projects they want to work on. This is done by putting all the projects on a whiteboard and pitching the projects to other students. After the project has been pitched, students get to select the projects they want to work on by adding their name to the whiteboard. After the event, a Delta lecturer takes pictures of the whiteboard and puts their names into an Excel sheet. This Excel sheet is then published on the student course and is available to all Delta students.
The data is formatted with students on the X-axis and projects as columns. In essence, it is a pivoted table. On which the relation of a student to a project and vice-versa is modelled. For this project, a static version of this Excel sheet is downloaded to create a dashboard on.
3. Standardizing data
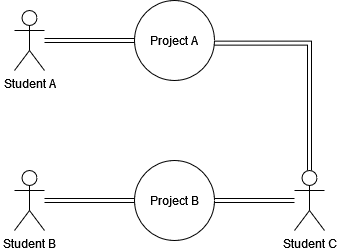
4. On network theory
The relation of student A to C could be explained as having to go through 1 edge instead of 2. This is because a project is a stand-in for interpersonal collaboration. The project can be removed to model the relation of a student to a student. This results in a model where student A and B are directly connected to one another.
5. Metric development
Now that I have a bipartite graph of student to student collaboration. It is possible to model the relations between students and their importance in the network. To do this, the aggregator metric for rankpage is used. Rankpage calculates the importance of one node in relation to its edges. This allows me to model how individual nodes affect the entire network, especially how important they are. Since rankpage uses a metric of 0-1, direct metrics can be put in place to calculate at-risk student. The first metric developed for Delta students is prominence. Prominence describes how important one node is to the entire network, if it is below a pre-set value, a student is considered at risk.
The second metric created is the average network similarity. To do this, I calculated the Simrank similarity of all students in the network. Then I take the average of simrank of a student to other students. The result is a metric that describes a set of students that are at risk of having a too similar collaboration network. In this case, the metric selected was 0.3025 based on manual testing.
6. App development
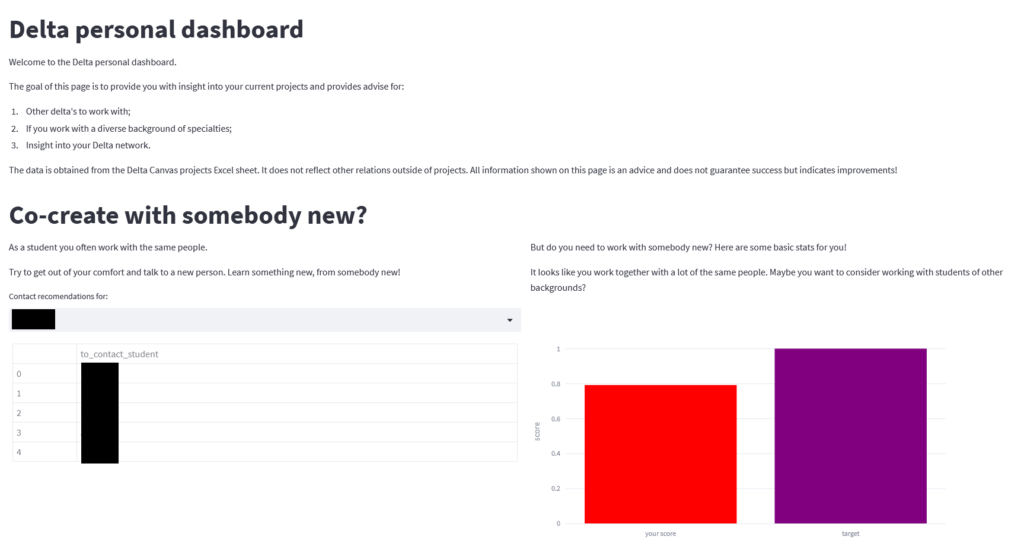
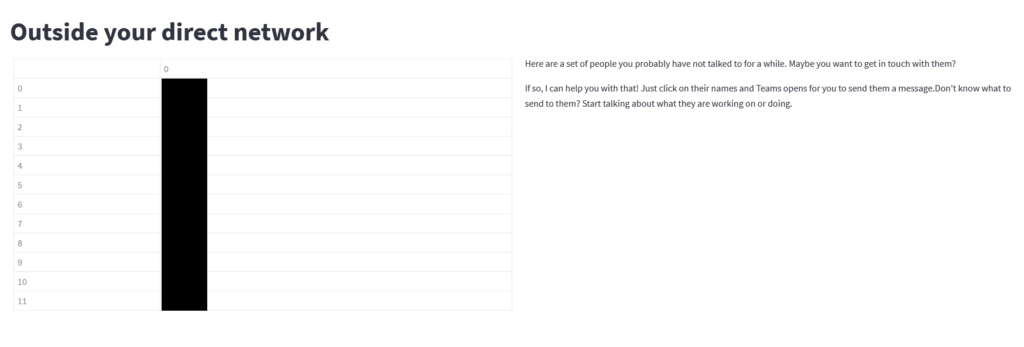
The result and metrics of the analysis were finally put into a dashboard where students can look themselves up and get back what their score and a suggestion of collaborations.
The collaborations were obtained using a similar method and calculating the bottom 5 similar students (I.E students not like the target student). These are then given back as a suggestion of students to work with.
The dashboard also shows the metric for network diversity. This is done by calculation of the diversity metric without the boolean operator. This value is then subtracted of one to get a range of solutions. In addition to this, lower values further away from the key metric are exaggerated to motivate students more to contact other students. Nudging students to engage with students they do not work with.
The final result is the Student Network Optimization dashboard that you can see below:
Conclusion
Student Network Optimization focuses on connecting students to one another. This product has focussed on providing an aggregate metric per student to gain insight into their risk and possible people to work with.
Feel like this could help your organization or school? Get in contact with me to talk about the possibility of implementing Student Network Optimization for your organization!
Sources:
- Python Pandas (https://pandas.pydata.org/) for data manipulation
- NetworkX (https://networkx.org/) for network manipulation
- StreamLit (https://streamlit.io/) for dashboard development
- Plotly (https://plotly.com/) for data visualization
- FHICT Delta (https://deltafhict.nl/) as data publishers