How to make your own AI LAB

Over the past six months, I have dedicated countless hours to building my own AI lab at home. In this article, I aim to guide you through the process of setting up your AI lab at home. First, let’s discuss the benefits and drawbacks of having an AI lab at home. Then, we will move on to installation instructions for setting up the lab on your computer.

Benefits of a local AI Lab

Having a local AI lab brings several advantages:

  1. Rapid testing of cutting-edge techniques and models: You can quickly try out new approaches without worrying about expensive cloud services or complex setup processes. This enables you to rapidly iterate and improve your AI applications.
  2. Cost savings: Running an AI lab locally means you only need to consider the costs of hardware and electricity. Since most home computers are already powerful enough to handle AI tasks, the initial investment can be relatively low. Additionally, there are no monthly fees or data storage charges associated with using an external service.
  3. Flexibility: With a local AI lab, you can experiment with different algorithms, libraries, and frameworks without being limited by vendor lock-in or proprietary software restrictions. This gives you greater control over your projects and enables you to tailor solutions to meet specific needs.
  4. Security: Running an AI lab locally allows you to maintain full control over your data and models. Unlike using cloud-based services, you don’t have to worry about security breaches or unauthorized access to sensitive information.
  5. Education: Building and maintaining an AI lab can provide valuable hands-on experience in AI development and deployment. By learning how to design, train, and deploy models, you can gain in-depth knowledge of AI technologies and best practices.

In summary, a local AI lab offers numerous benefits, including rapid prototyping, cost savings, flexibility, security, and education. These advantages make it an attractive option for developers looking to create AI applications and solutions.

Downsides of a local AI Lab

Having your own AI Lab does bring some downsides with it. In my professional and personal experience with these systems, these are as follows:

  1. Upfront cost: Creating your own AI Lab involves significant upfront costs such as buying a motherboard, cables, and licensing costs for the Windows operating system (OS). These costs can be prohibitive for those with limited budgets. However, if you already have a gaming PC, you may have bypassed most of the upfront costs for running your homebrew AI models.
  2. Maintenance responsibility: When you run an AI lab locally, you become responsible for all maintenance tasks. This includes both software and hardware maintenance. If you are new to software and hardware maintenance, it will be an uphill battle for you.
  3. Limited capabilities: Your AI lab might not be able to do everything you want. Balancing your workload becomes crucial when using an AI lab at home. You need to carefully identify which tasks you want to prioritize and focus on.

These are the main downsides of having a local AI Lab. It’s important to consider these factors before deciding whether creating your own lab is the right choice for you.


Hardware and software requirements

To have your own local AI Lab you will need the following:

Minimum

  1. 16 Gb of memory
  2. An nvidia video with CUDA support with atleast 8Gb of VRAM
  3. 64 Gb of availible storage
  4. Have Git installed
  5. Have python installed
  6. Have anaconda installed
  7. Have CUDA toolkit installed

Adviced

  1. 32 Gb of memory
  2. An nvidia video with CUDA support with atleast 12Gb of VRAM
  3. 64 Gb of availible storage
  4. Have Git installed
  5. Have python installed
  6. Have anaconda installed
  7. Have CUDA toolkit installed

Installing your local AI lab

To kick off your local AI lab, you should start by identifying a set of tasks you want to perform. For each task, there are hundreds of systems you could use AI for. In this article, we assume you want to either use DALL-E3 image generation systems or your own ChatGPT.


To get your own local Dalle3, you will need to install the Stable Diffusion WebUI. This is a web browser application that allows you to generate images. For your first instance, you will start with the 1.5 version of Stable Diffusion. Simply said, if you have the minimum requirements, you can run this.

To install Stable Diffusion WebUI, follow these steps:

1. Make sure you have Python and Git installed.
2. Open the terminal at a directory of choice.
3. Use the following command in your terminal: `git clone https://github.com/AUTOMATIC1111/stable-diffusion-webui`
4. Double click on `webui-user.bat` on Windows or type `bash webui-user.sh` on Linux to run the script.
5. Wait for it to install, which could take 15 minutes.
6. Go to the following URL: `http://127.0.0.1:7860/`.

Now you have a local install of Dalle3 that you can play with to your heart’s content!

Now that you have installed text generation and/or the Stable Diffusion WebUI, you can play with it without any difficulties or limitations. In future articles, I will provide you with a list of potential sources from which you can obtain additional models to experiment and play with.

If you want to explore the possibilities of AI further, check out my guide on converting any portrait into an art style using the Stable Diffusion WebUI. (link)

If you want tutorials on other topics related to AI or implementing these technologies, please feel free to contact me.

– Niels van der Burg

Email: info@nielsjburg.nl
Feel like inovation is around the corner?

How to change your selfie into an oil painting using AI

Example of image style transfer using Stable Diffusion

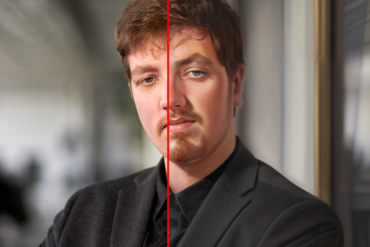
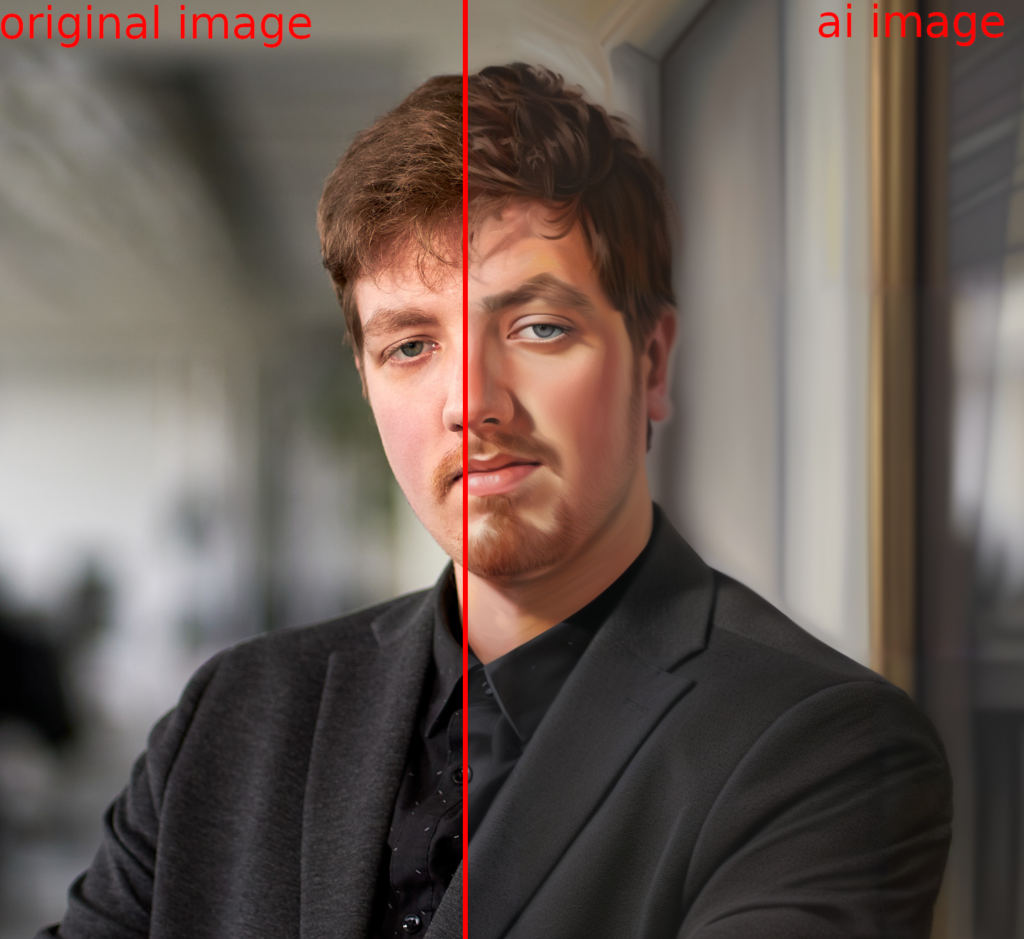
With image generators like OpenAI’s Dall-E 2 and Midjourney, you can create visually appealing images with just a few words. However, if you have an existing image that you want to transfer a new style onto, it becomes a bit more challenging. Fortunately, with the use of local or private cloud AI, you can easily transfer styles onto any image you have. In this short tutorial, I will show you how to transfer a portrait of a person to a set of art styles.

I highly recommend reading the article from DataCamp.com on installing Stable Diffusion WebUI.

Improving the quality of AI-generated images using ControlNet

If you are familiar with Stable Diffusion WebUI, you know that it generates high-quality images. However, sometimes the results may not be exactly what you want or expect. That’s where ControlNet comes into play. With ControlNet, you can fine-tune the generation process and achieve even better results.

What is ControlNet?

ControlNet is an extension for Stable Diffusion WebUI that enables you to control specific aspects of the image generation process. It works by extracting certain features (e.g., contours, depth, or base image) from source images and transferring them onto the generated images. This helps the AI model focus on generating specific details or characteristics of the desired image.

How to use ControlNet?

To use ControlNet, follow these steps:

1. Install the ControlNet extension: Go to the Extension tab in Stable Diffusion WebUI and select “Load from.” Find the “sd-webui-controlnet” extension and click “Install.”

2. Download the required models: Tile and Lineart. Place these models in the extensions/sd-webui-controlnet/models folder inside the Stable Diffusion WebUI directory.

3. Enable multi-ControlNet: Go to Settings > ControlNet and increase the value of the Multi ControlNet slider to 2. This will allow you to run two ControlNet models simultaneously.

4. Generate an image: Choose an appropriate prompt and generate an image.

5. Configure ControlNet: For each ControlNet model, specify the source image path and the type of feature extraction (contours, depth, or base image).

6. Adjust the balance between stability and fidelity: The Balance parameter determines the tradeoff between maintaining the original image structure and achieving detailed features. Lower values prioritize structure, while higher values emphasize detail. You can adjust this parameter in the individual ControlNet configurations.

Transferring style

To transfer the style onto your image of choice, you need to go to the tab labeled ‘img2img’. Drag your desired image into the canvas, then set Denoising to 0.50.

Next, set Resize Mode to ‘Crop and Resize’. Then, go to ControlNet and click on the radio button labeled ‘Tile’. Enabling this model will turn on the ControlNet Tile Model.

Go to ControlNet Unit 1 and select LineArt as your Image Style. Select ‘LineArt_Realistic’ from the dropdown menu for Preprocessor, which will set the preprocessor to create realistic representations of contours instead of creating lineart over everything. Enable this model.

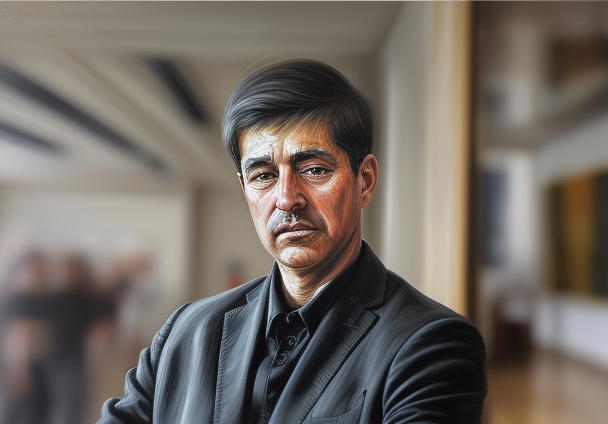
Finally, go back to the top and use this prompt to create an oil painting of yourself: For this generation, I got this image back:

AI style transfer without taking the entire image as input.

In my case, it got close, but it changed me to much. It turned me 40 years older and it added details that did not exist.

This is where the human work comes in. Now, all you have to do is tweak the denoise you changed earlier to try and get the result you want.

In my case and maybe in your case to, this did not work. If that is the case, keep on reading.

The classic old tale of more data

In my case, the failure was due to reducing the amount of information in the source image. We reduced a 2000×2000 pixel image to a 512×512 pixel image, destroying half of the total data. Of course it is going to have difficulties running it then! But how to we fix this?

All we need to do is make sure the AI can see all the pixels. The ‘SD Upscale’ extension allows us to use each pixel of the base image as a reference rather than requiring additional memory.

To install it, go to Extensions, Installed, and find ‘Ultimate-Upscale-for-automatic1111‘. Download and restart the server.

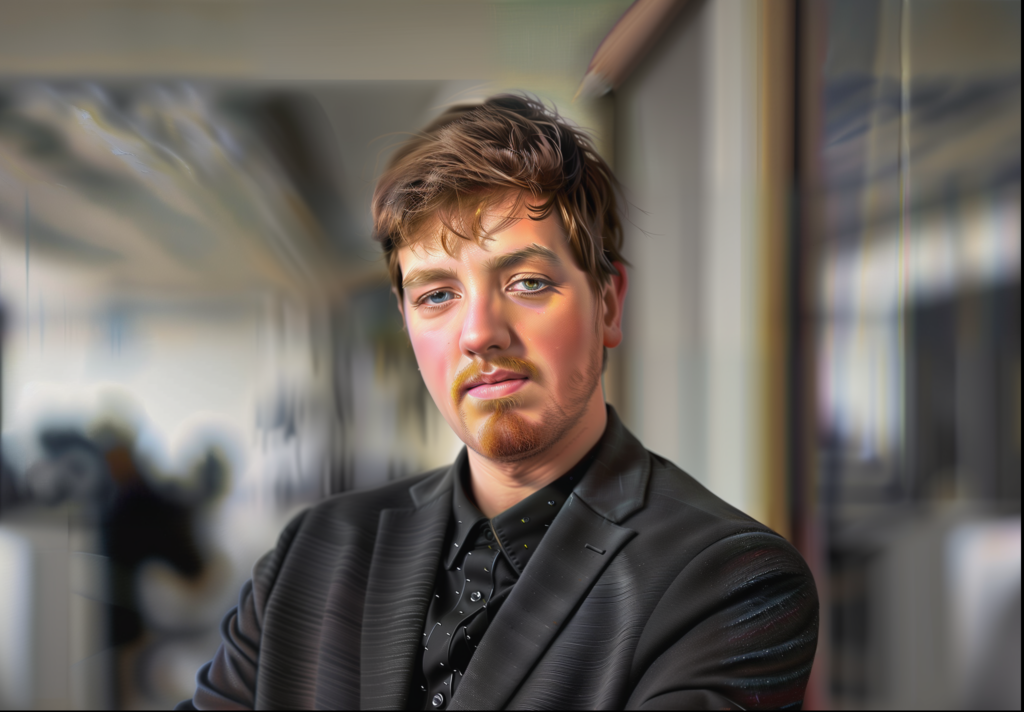
Repeat the previous steps. When done, go to Resize to and choose Resize by. Set it to 1. Then go to the bottom and choose Script and select ‘Ultimate SD Upscale’. Finally, click Generate. This process may take longer, so give it some time. After approximately one minute, I got the following image back.

Improved version of the image

After a few seconds of image generation, I get the following image back. Just as the doctor ordered. Experimenting with different styles and controlnets can create near endless possibilities for artistic expression. Don’t hesitate to try it out!

Use cases of this AI workflow

Here are some ideas of what you could do with this AI workflow to create a unique experience for yourself or your clients.

1. Personalized photos: You can use this AI workflow to create unique and memorable images of yourself or loved ones by incorporating various artistic styles into your portrait. A company I work with does wonderful work with this (www.wesmilebooth.nl)

2. Marketing materials: Whether it’s an advertisement, brochure, or website design, incorporating distinctive visual elements can help make your brand stand out from the competition.

3. Artistic expression: This technology allows artists to explore new creative avenues by combining their own artwork with that of others in unexpected ways.

4. Education: Students can learn about different art movements and eras through hands-on experimentation with this AI workflow.

5. Historical preservation: By digitizing old photographs and paintings using this technology, we can ensure that these valuable pieces of history don’t get lost over time.

These are just a few examples of how this AI workflow can be applied across different industries and disciplines. As with any emerging technology, there will undoubtedly be even more innovative uses as developers continue to push the boundaries of what’s possible.

If you are interested in the possibilities of image generation for your company, feel free to contact me for a quick demo!

Feel like inovation is around the corner?

Student Network Optimization

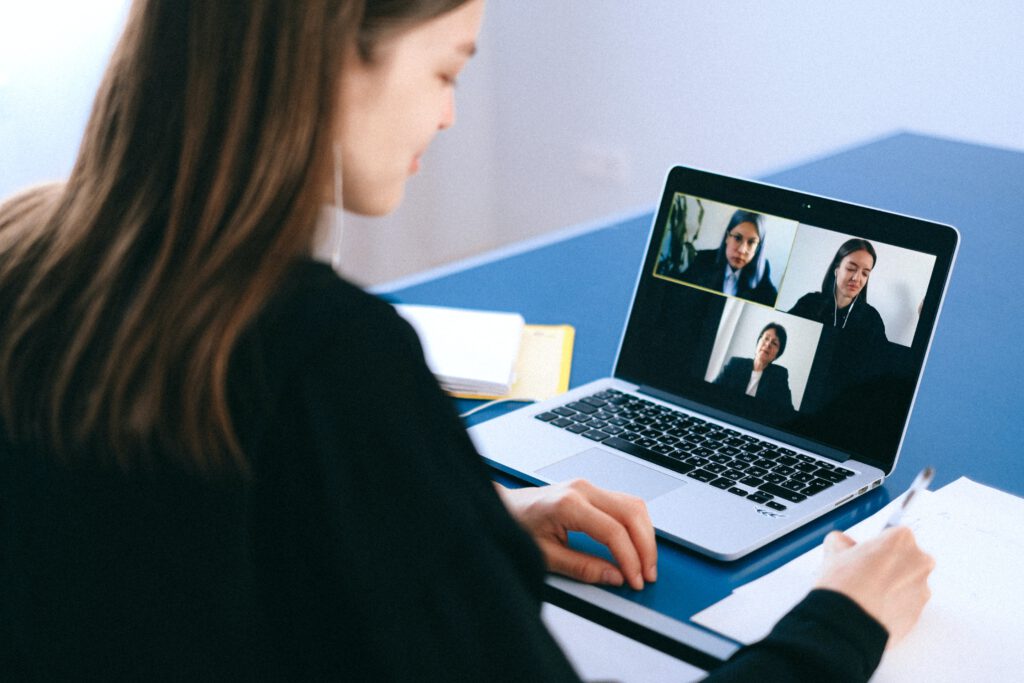
Student talking in teams to connect with other students

Student Network Optimization focuses on connecting students to each other with different profiles. An art student could learn a different perspective on their work from a business lead and vice-versa. This project focused on providing a tool to give an indication for student collaboration. To expand their network and knowledge.

1. Background

Prior to starting any project, it is crucial to get good background information on the environment. The project started as an FHICT-Delta experiment. Delta is the excellence track for Fontys ICT students. In this track, students get the possibility to handle projects with almost full autonomy.  Lecturers are rarely involved with projects, only on request of a student and in situations where the students could fail the semester. This results in an environment where students explore their own skills and the context they want to work with. As a Delta student myself, I started to focus on data and organization processes. During my second semester as a Delta, I started to notices that there are clusters of students that often work together. The arts & media-, software and technology clusters are easy to pick out once you start to work on projects. As these clusters begin to form, they focus more and more on their issues and leave other perspectives on their work to the side. If not approached at an early moment, a division of knowledge and experience occurs within student groups will occur.
 
The goal of the project is to create a product that can connect students of different backgrounds to each other based on current collaborations.
Based on the information provided, the task of the project were as follows:
  • Obtain data,
  • Standardize the data,
  • Create metrics to quantify student network diversity,
  • Develop a dashboard to assist students.

2. Data obtainment

At the beginning of a semester, all Delta students get together to select the projects they want to work on. This is done by putting all the projects on a whiteboard and pitching the projects to other students. After the project has been pitched, students get to select the projects they want to work on by adding their name to the whiteboard. After the event, a Delta lecturer takes pictures of the whiteboard and puts their names into an Excel sheet. This Excel sheet is then published on the student course and is available to all Delta students.

The data is formatted with students on the X-axis and projects as columns. In essence, it is a pivoted table. On which the relation of a student to a project and vice-versa is modelled. For this project, a static version of this Excel sheet is downloaded to create a dashboard on.

3. Standardizing data

Because the table is in a pivot format and the only goal is to model the relation between students and projects. The wide-format table is converted to a long-format and empty values, that indicate that a student is not part of a project, are removed. The result of it is a long format table with students and the projects they participate in.
 
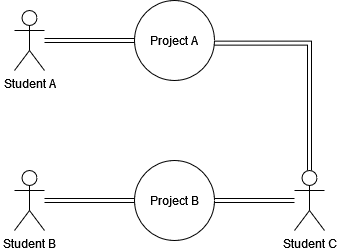
This long-format table is then converted to a network graph. This allows me to model the relation of students to projects. More importantly, it allows me to convert the table to a bipartite graph. This gives me the ability to remove projects and directly model the collaboration network of student to student.

4. On network theory

Now that a data model is created, I can look into creating metrics to define at risk students. For this it is crucial to lay a foundation from which we can have a common vocabulary.
 
A network graph consists out of 2 components. The first component is a node, this is an individual description of data that could describe its relation to other nodes. An edge is the relation between 2 nodes. In this case, that is the relations between students and a project.
 
The network is a bipartite graph, this means that there is a different set of relations. In this case, a student is connected to a project and vice versa. But based on the data model, it is not possible for a student to have a direct edge with another student. This means that the data consists out of 2 separate data types, making it a bipartite graph.

The relation of student A to C could be explained as having to go through 1 edge instead of 2. This is because a project is a stand-in for interpersonal collaboration. The project can be removed to model the relation of a student to a student. This results in a model where student A and B are directly connected to one another.

Student Network Optimization
Bipartite graph example

5. Metric development

Now that I have a bipartite graph of student to student collaboration. It is possible to model the relations between students and their importance in the network. To do this, the aggregator metric for rankpage is used. Rankpage calculates the importance of one node in relation to its edges. This allows me to model how individual nodes affect the entire network, especially how important they are. Since rankpage uses a metric of 0-1, direct metrics can be put in place to calculate at-risk student. The first metric developed for Delta students is prominence. Prominence describes how important one node is to the entire network, if it is below a pre-set value, a student is considered at risk.

The second metric created is the average network similarity. To do this, I calculated the Simrank similarity of all students in the network. Then I take the average of simrank of a student to other students. The result is a metric that describes a set of students that are at risk of having a too similar collaboration network. In this case, the metric selected was 0.3025 based on manual testing.

6. App development

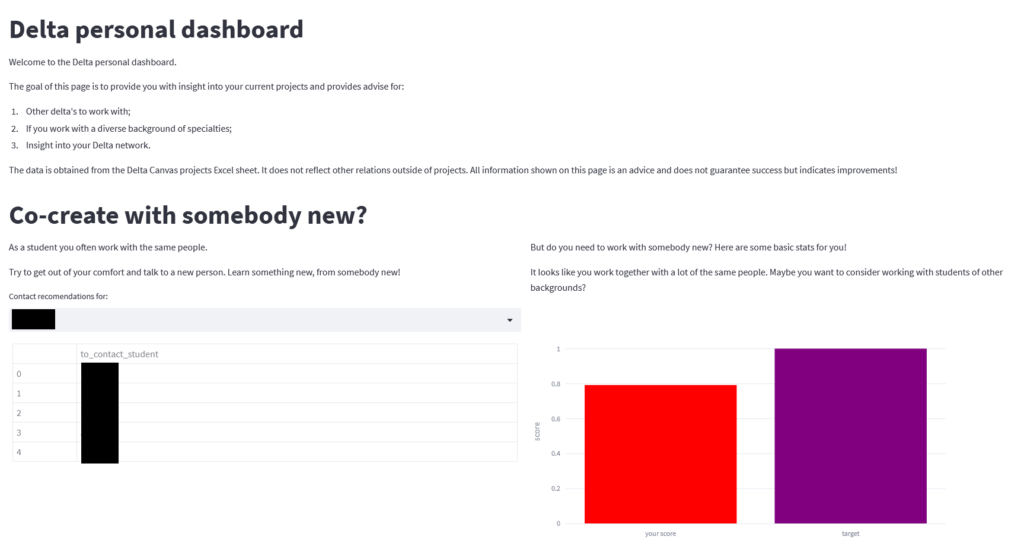
The result and metrics of the analysis were finally put into a dashboard where students can look themselves up and get back what their score and a suggestion of collaborations.

The collaborations were obtained using a similar method and calculating the bottom 5 similar students (I.E students not like the target student). These are then given back as a suggestion of students to work with.

The dashboard also shows the metric for network diversity. This is done by calculation of the diversity metric without the boolean operator. This value is then subtracted of one to get a range of solutions. In addition to this, lower values further away from the key metric are exaggerated to motivate students more to contact other students. Nudging students to engage with students they do not work with.

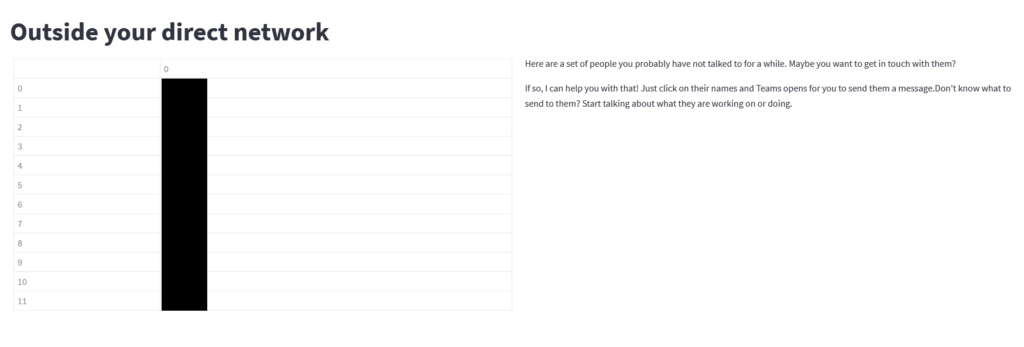
The final result is the Student Network Optimization dashboard that you can see below:

Conclusion

Student Network Optimization focuses on connecting students to one another. This product has focussed on providing an aggregate metric per student to gain insight into their risk and possible people to work with.

Feel like this could help your organization or school? Get in contact with me to talk about the possibility of implementing Student Network Optimization for your organization!

Sources:

Want to modernize your processes?​